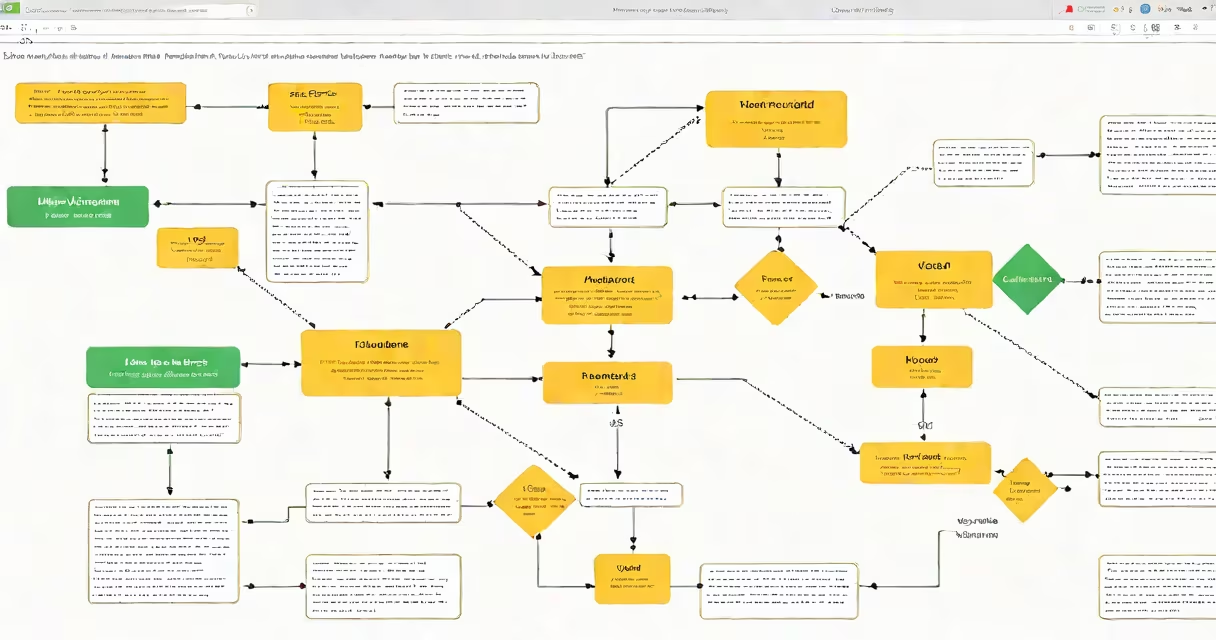
Use Google Docs' drawing tool to create a flowchart by inserting shapes, connecting them with lines, and adding text to represent steps in a process. This method supports basic visual logic mapping without external software.
Google Docs doesn't include a dedicated flowchart editor, but its built-in Drawing tool enables users to build custom diagrams. You start by accessing the Insert menu, selecting Drawing, then choosing New. Once inside the drawing canvas, you select shapes from the toolbar-like rectangles for steps, diamonds for decisions-and arrange them in sequence. Lines connect the shapes to show direction. Text is added by double-clicking a shape and typing.
For example, creating a customer onboarding flowchart involves placing a rectangle labeled "User signs up" at the top, linking it via a line to a diamond labeled "Email verified?" with arrows pointing to "Yes" and "No" branches. A final rectangle labeled "Account activated" completes the path. All elements stay editable within the document.
The Drawing tool operates in a lightweight interface that functions similarly to a basic vector editor. Shapes appear in a palette under the "Shapes" tab. Click and drag to place each shape on the canvas. To resize, hover over a corner until the cursor becomes a diagonal arrow, then drag. To rotate, click and drag the small circle above the shape.
Lines and arrows are drawn using the "Line" tool. Select it, then click and drag between two shapes. The line automatically snaps to alignment points on the shapes, ensuring clean connections. For curved or angled lines, hold Shift while dragging to constrain angles to 45-degree increments.
Once complete, click "Save and Close" to embed the diagram into your Google Doc. The image appears as a static element unless you double-click it to reopen the editing window. Changes made later require reopening the drawing from the document.
Flowcharts fall into several categories based on purpose. Process flowcharts map sequences of actions, such as a software deployment pipeline. Decision trees evaluate options based on conditions, useful in troubleshooting guides. Swimlane diagrams divide responsibilities across teams or roles, often used in project management.
For instance, a marketing team might use a swimlane flowchart to track content creation: one lane for writers, another for editors, and a third for designers. Each task is placed in the corresponding lane, with arrows indicating handoffs. This format clarifies ownership and reduces overlap.
| Type | Best for | Shape usage |
|---|---|---|
| Process flowchart | Standard workflows | Rectangles, arrows |
| Decision tree | Conditional paths | Diamonds, branching lines |
| Swimlane | Team-based processes | Vertical lanes, colored zones |
A common mistake is using inconsistent shapes. Rectangles should represent actions, diamonds for yes/no decisions, ovals for start/end points. Mixing shapes confuses readers. The U.S. National Institute of Standards and Technology (NIST) recommends standardized symbols in technical documentation to improve clarity and reduce misinterpretation.
Many users assume Google Docs supports automatic layout features like auto-spacing or alignment. It does not. Shapes must be positioned manually. Overlapping elements occur when dragging shapes too quickly. Always use the "Align" tool under the Arrange menu to center or distribute objects evenly.
Another error is embedding the drawing at low resolution. When resizing the image in the document, the quality degrades if the original drawing wasn't set to high resolution. To prevent blurriness, ensure the drawing canvas size is at least 800x600 pixels before saving.
I once built a flowchart for a school's emergency response plan. After inserting 12 shapes and 14 connection lines, I noticed the final version looked cluttered. Reorganizing the layout in a grid pattern-placing decision nodes in the center and paths radiating outward-improved readability. The revised version was shared with staff and reduced confusion during drills.
If you need advanced features like changing linking, conditional formatting, or export to SVG/PDF with embedded metadata, consider using dedicated tools like Lucidchart, Draw.io, or Microsoft Visio. These platforms integrate with Google Workspace but offer deeper functionality.
However, for quick internal documentation, training materials, or student assignments, Google Docs suffices. The simplicity of the Drawing tool lowers the barrier to entry. According to Google's official documentation, the tool supports collaboration in real time-multiple users can edit the same drawing simultaneously, with changes visible instantly.
Creating a flowchart in Google Docs requires no installation, runs entirely in the browser, and stays accessible across devices. It's ideal for educators, students, and remote teams needing to visualize processes without switching platforms.
Use the Drawing tool to build clear, shareable diagrams. Start with a single shape, define the next step, connect them, and repeat. Keep labels concise. Save frequently. Test the flow by walking through it aloud. That's how to create a flowchart in Google Docs effectively.