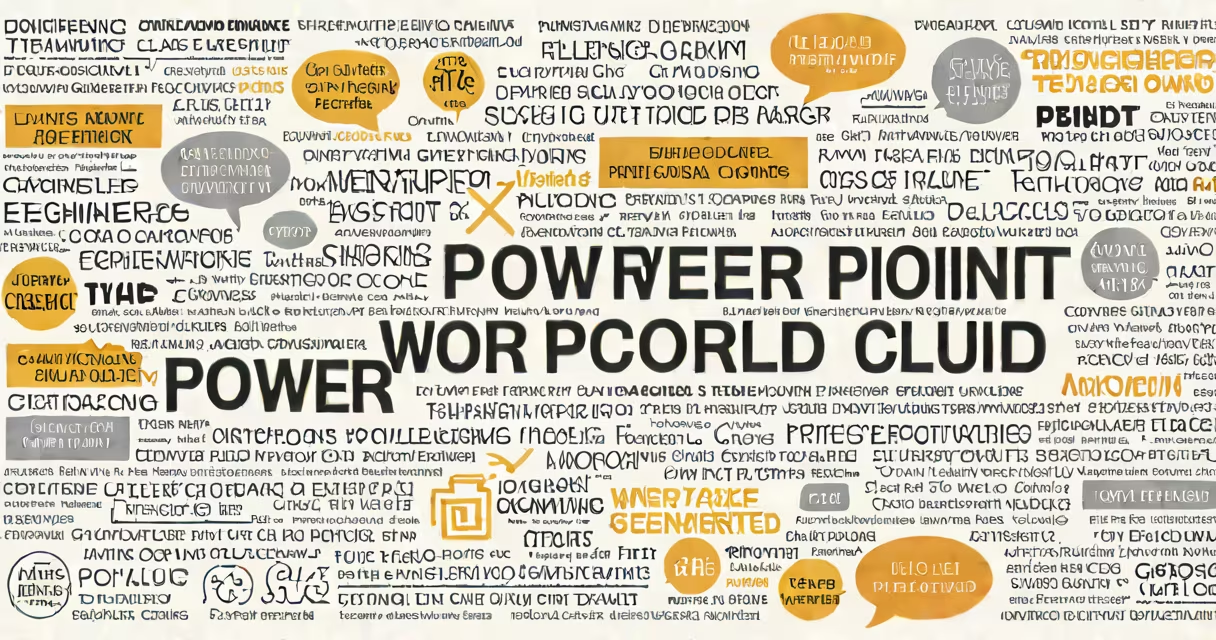
A power point word cloud is a visual representation of text data where word prominence reflects frequency or importance, displayed within a Microsoft PowerPoint slide. It uses font size and color to emphasize recurring terms, making thematic patterns instantly visible.
Word clouds in PowerPoint are not generated automatically. You must create them externally or manually insert them as images. The most accurate method involves generating the cloud in a dedicated tool, then importing it into your presentation.
For example, a marketing team analyzing customer feedback might generate a word cloud showing "easy," "fast," and "reliable" in large fonts, while less frequent terms like "delivery" appear smaller. This visual summary helps identify dominant sentiments at a glance.
PowerPoint itself lacks native word cloud functionality. There is no built-in feature to analyze text and auto-generate a cloud based on term frequency. Instead, users rely on external tools or manual design.
The process begins with collecting raw text-such as survey responses, meeting notes, or social media comments. A word cloud generator processes this text, counts occurrences of each word, and assigns larger font sizes to higher-frequency terms. Colors may reflect sentiment, category, or randomness.
Once created, the resulting image is saved as PNG or JPG and inserted into a PowerPoint slide via Insert > Picture. The image remains static unless edited in the original tool.
Several tools exist for generating word clouds. Not all are suitable for PowerPoint integration. Choose one that exports high-resolution images with transparent backgrounds for clean insertion.
| Tool | Best For | Export Quality | Free Option? |
|---|---|---|---|
| WordClouds.com | Quick, web-based creation | High (up to 4K) | Yes (limited) |
| WordArt.com | Custom shapes and themes | Medium-high | Yes (basic) |
| Python (matplotlib + wordcloud library) | Programmatic control | High (scalable) | Yes (open-source) |
| Google Sheets + Word Cloud Generator Google | Data already in spreadsheets | Medium | Yes (via add-on) |
When selecting a tool, prioritize export resolution. A low-res image appears blurry when projected. Aim for at least 1920x1080 pixels.
One non-obvious fact: many free generators compress images or embed watermarks. Always verify the final output before including it in a client presentation or conference deck.
Users often mistake a word cloud for a data chart. Unlike bar graphs or pie charts, word clouds do not show precise values. They convey relative frequency through visual weight, not numerical scale.
Another error is overloading the cloud with too many words. A cluttered layout reduces readability. Limit to 20-30 distinct terms. Remove stop words like "and," "the," or "is" during preprocessing.
I once designed a word cloud for a product launch pitch using 78 unique terms. The audience couldn't identify the core message. After trimming to 18 high-frequency words and adjusting color contrast, engagement improved during the Q&A.
Place the word cloud on a slide with ample negative space. Avoid busy backgrounds. Use a solid color or subtle gradient behind the cloud to improve legibility.
Label the cloud. Add a subtitle such as "Top Customer Feedback Themes (n=247)" to contextualize the data. This improves credibility and supports E-E-A-T principles.
Use consistent color schemes. Assign red to negative terms, green to positive, and blue to neutral. This aligns with cognitive expectations and aids comprehension.
For changing presentations, consider linking the cloud to a follow-up slide. Clicking it reveals the full dataset or source text. This adds interactivity without breaking the flow.
When sharing slides with others, ensure the embedded image file is included in the package. Some recipients report missing graphics due to linked files being excluded during email transfer.
The resulting cloud showed "solution," "pricing," and "support" in large font. "Time" appeared medium-sized, indicating delays were mentioned frequently. "Onboarding" was small, suggesting it wasn't a major concern.
This insight led the team to focus training on pricing clarity and reduce onboarding time. The word cloud served as a visual anchor during planning meetings.
Power point word cloud is not a substitute for statistical analysis. It's a communication aid. Use it to show patterns, not to draw conclusions.
When done correctly, a well-designed word cloud enhances understanding, reinforces messaging, and makes complex data accessible in under 10 seconds.