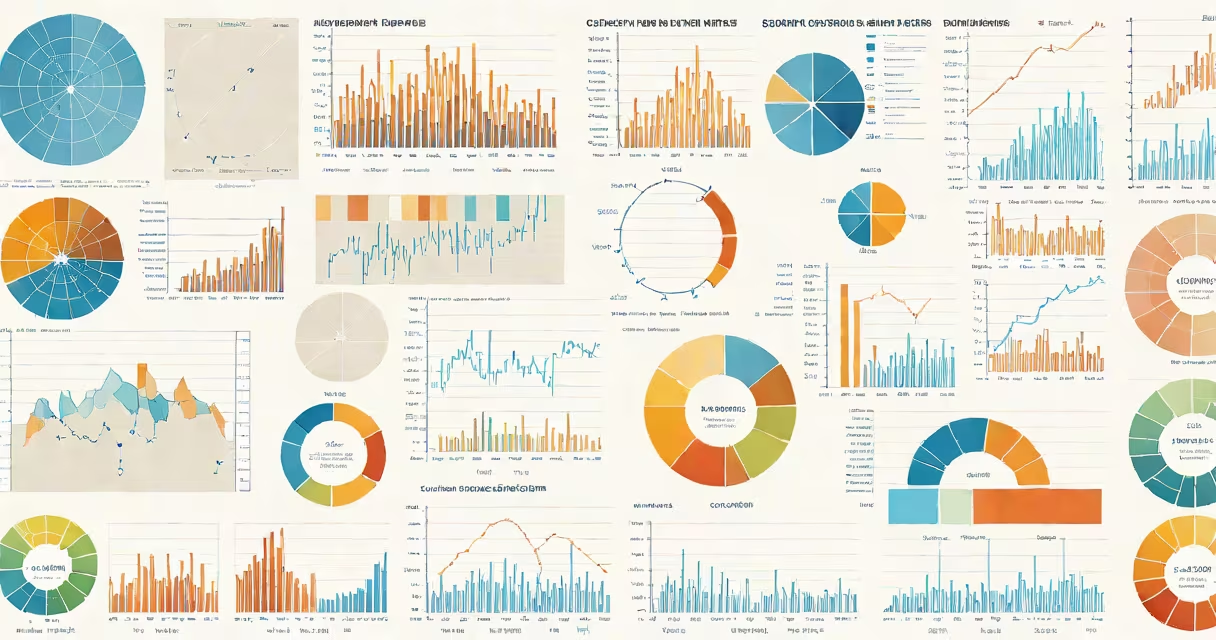
Types of charts and graphs are visual tools that represent data using shapes, lines, and colors to show patterns, comparisons, and changes over time. They make complex numbers easier to understand at a glance.
Charts and graphs differ from raw tables by emphasizing relationships. A bar chart compares quantities across categories. A line graph shows change over time. A pie chart displays parts of a whole. A scatter plot reveals connections between two variables. Each serves a distinct purpose based on the data being shown.
These tools are standard in business reports, scientific papers, news articles, and educational materials. Choosing the right type ensures the message is accurate and instantly readable. Misusing a chart can distort perception or hide key insights.
Each chart type uses spatial relationships to convey meaning. Bar charts place bars along an axis to compare values. The longer the bar, the higher the value. This makes differences easy to spot visually.
Line graphs connect data points with lines. The slope of the line indicates whether values rise or fall. Steep slopes mean rapid change. Flat lines show stability. This format excels at showing trends over continuous intervals like days, months, or years.
Pie charts divide a circle into slices. Each slice's size corresponds to its share of the total. This works well when showing proportions, such as market share or budget allocation. But they fail when there are too many categories or when slices are similar in size.
The following table outlines the most widely used types, their strengths, and typical applications.
| Type | Best For | When to Avoid |
|---|---|---|
| Bar Chart | Comparing values across categories | Showing trends over time |
| Line Graph | Tracking changes over time | Displaying large numbers of categories |
| Pie Chart | Showing parts of a whole | More than five categories or small differences |
| Scatter Plot | Identifying correlations between two variables | Overlapping data points or dense clusters |
| Heat Map | Highlighting intensity across rows and columns | Requiring precise numerical values |
For example, a company tracking monthly sales from January to December would use a line graph. The x-axis lists months, the y-axis shows revenue. Connecting the points reveals growth patterns and seasonal dips. A bar chart would show the same data but focus on comparing each month's performance side by side.
A university analyzing student enrollment by major might use a pie chart. If 40% of students are in STEM fields, 30% in humanities, and 30% in social sciences, the pie shows the largest group. But if there were 12 majors, the slices would be too thin to distinguish.
Many people assume pie charts are ideal for all percentage-based data. That's incorrect. Research from Edward Tufte, author of *The Visual Display of Quantitative Information*, shows that humans struggle to judge angles accurately. We're better at comparing lengths.
As a result, a bar chart often communicates proportions more than a pie chart. For instance, when comparing the percentage of Americans who support renewable energy (68%) versus fossil fuels (24%), a bar chart makes the gap more obvious than a pie chart with two slightly different-sized slices.
Another common error is using 3D effects in charts. These distort perception. A 3D bar chart may make one bar appear taller due to perspective, even if the value is the same. The U.S. National Institute of Standards and Technology (NIST) warns against such visual tricks because they reduce accuracy and increase misinterpretation risk.
In 2022, the Centers for Disease Control and Prevention (CDC) published data on flu cases across U.S. states. To show regional variation, they used a heat map. Each state was shaded by color intensity based on reported cases per 100,000 people.
This format allowed users to quickly identify hotspots. States with high rates appeared dark red. Low-rate areas were light yellow. A line graph would have required plotting 50 separate lines-one per state-making it hard to follow.
Later, the CDC released a line graph showing national flu activity over 12 weeks. The y-axis tracked the percentage of doctor visits due to flu-like symptoms. The peak occurred in week 8, aligning with winter surges. This single line told a complete story of timing and severity.
I once reviewed a report where a pie chart incorrectly labeled a category as "Other" with a 15% slice. Upon checking the original data, the "Other" group contained four subcategories totaling 12%. The chart misrepresented the distribution. Switching to a stacked bar chart clarified the breakdown.
Start by asking: What am I trying to show? Is it a trend? A comparison? A proportion? A relationship?
If you're showing how website traffic changed over six months, use a line graph. If you're comparing revenue by product line, choose a bar chart. If you're illustrating how income level relates to education attainment, a scatter plot with a trendline is best.
Always label axes. Use consistent scales. Avoid clutter. Remove unnecessary gridlines or decorative elements that distract from the data.
For example, a nonprofit presenting donation amounts by donor region used a horizontal bar chart. The bars extended left from the y-axis, making it easier to read long region names. The chart included a legend and a note: "Data from 2023 fiscal year."
When in doubt, test the chart with someone unfamiliar with the data. If they can't explain the main point within 10 seconds, simplify it.
Understanding types of charts and graphs improves clarity in communication. Whether in school, work, or public reporting, accurate visual representation prevents confusion and supports informed decisions.