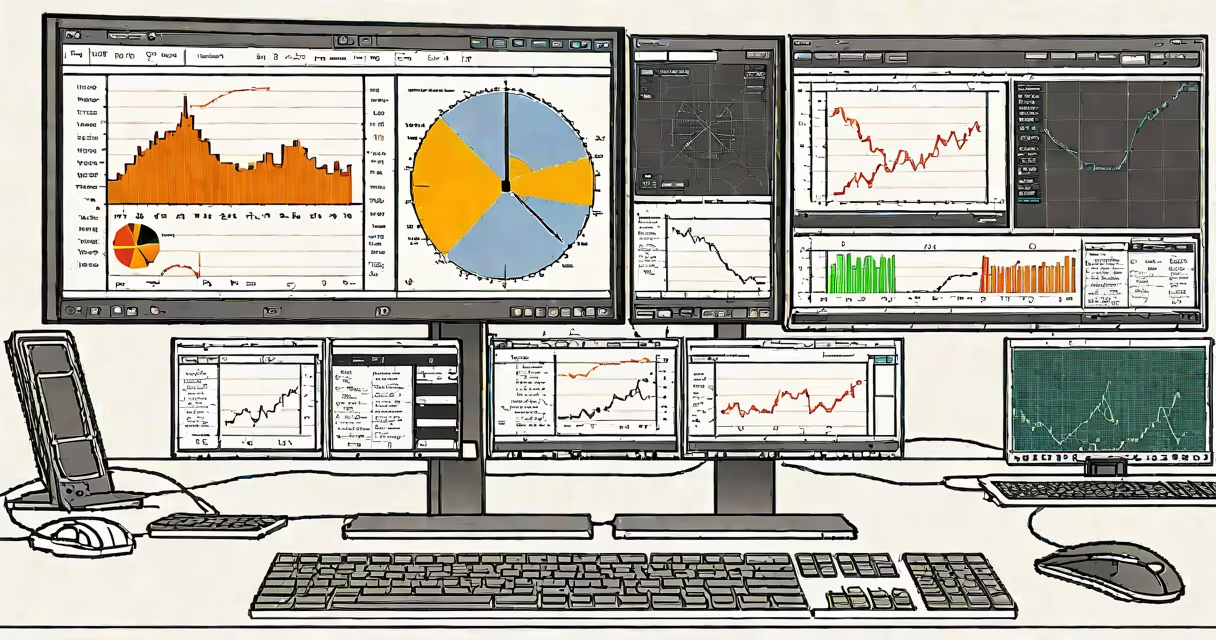
A pc performance monitor is a software or hardware tool that tracks real-time system activity-including cpu, gpu, ram, disk, and network usage-to diagnose performance issues, prevent crashes, and improve system responsiveness. It displays live data on resource consumption, temperature, clock speeds, and power draw, enabling users to detect bottlenecks, overheating, or abnormal processes.
These tools run continuously in the background or as lightweight overlays. They collect data from sensors embedded in the motherboard, cpu, gpu, and storage devices. Data is processed and visualized through graphs, gauges, or numerical readouts. Some monitors log historical data for later analysis, while others trigger alerts when thresholds are exceeded.
Modern pc performance monitors integrate with operating systems via APIs. Windows uses WMI and Performance Counters; macOS relies on IOKit and System Statistics; Linux accesses /proc and /sysfs. Third-party tools like HWMonitor, Core Temp, and MSI Afterburner extract raw sensor values and display them in user-friendly formats.
When a process runs, the operating system records how much of each resource it consumes. A pc performance monitor queries these records at regular intervals-typically every 0.5 to 1 second-and plots them over time. For example, if a video editor opens a 4K file, the monitor may show a spike in cpu usage from 20% to 95%, gpu memory usage rising from 1GB to 6GB, and disk I/O peaking at 120MB/s.
Sensors on the motherboard report temperature, voltage, and fan speed. The monitor correlates this with workload. If the cpu hits 90°C during rendering, the tool flags thermal throttling. If fans aren't spinning fast enough, it warns of potential overheating. These signals help users decide whether to close apps, clean dust, or upgrade cooling.
Some monitors support logging. Over a 24-hour period, they record every change in resource load. This data can reveal patterns-like a background update consuming 80% of disk bandwidth every night at 2AM-or anomalies such as a rogue process using 100% of a core.
There are two main categories: software-only monitors and hybrid tools that combine software with external hardware sensors.
| Type | Examples | Use Case | Accuracy Source |
|---|---|---|---|
| Software-only | Task Manager (Windows), Activity Monitor (macOS), htop (Linux) | Basic diagnostics, quick checks, troubleshooting startup delays | OS-provided counters and kernel interfaces |
| Third-party software | HWMonitor, Core Temp, Open Hardware Monitor, MSI Afterburner | Overclocking, gaming performance tuning, long-term stability testing | Direct access to SMBus, I2C, and sensor registers |
| Hardware dongles | Thermaltake Core V2, NZXT Kraken X63 (with built-in monitor) | Real-time feedback during high-load tasks, custom lighting integration | Dedicated microcontroller reading sensor data via USB or PCIe |
Open Hardware Monitor, for example, reads SMBus data from the motherboard's EC (embedded controller) to pull temperature and fan speed values. It supports over 200 chip models and can export logs in CSV format for later analysis. A user running a 3D render job saw GPU temps climb to 87°C and GPU utilization hit 99%. The tool alerted them before the system crashed due to thermal shutdown.
Not all monitors are equal. Built-in tools like Windows Task Manager report average cpu usage over 1-second intervals. Third-party tools like HWMonitor sample sensors every 0.2 seconds, capturing spikes that Task Manager misses. This difference matters during benchmarking or when debugging intermittent freezes.
Many assume a pc performance monitor is the same as a game overlay or a task manager. That's incorrect. While both show resource usage, monitors provide deeper insight into hardware health and sustained performance.
Another mistake is thinking that high cpu usage always means poor performance. A single core hitting 100% during a compile task is normal. But sustained 100% usage across all cores indicates a problem-either a misbehaving app or failing cooling. A monitor helps distinguish between expected load and actual failure.
Some users confuse a pc performance monitor with a system profiler. Profilers track function calls and memory allocation during development. Monitors track system-wide resource consumption. You'd use a profiler to debug a Python script; a monitor to see why your laptop froze during a Zoom call.
One non-obvious fact: many monitors rely on the OS's power management settings. If a laptop is set to "battery saver," the monitor may report lower cpu frequency and reduced clock speeds-not because the system is slow, but because power saving is active. Always check power mode before diagnosing performance issues.
Consider a user whose game, Cyberpunk 2077, takes 90 seconds to launch. They open their pc performance monitor (MSI Afterburner) and start recording. During launch, the monitor shows:
The monitor reveals that the game is loading assets from disk while the cpu handles AI calculations. But the RAM usage is near capacity, suggesting a swap to virtual memory. The user checks Task Manager and finds a background antivirus scan consuming 30% of cpu and 5GB of RAM. They pause the scan, restart the game, and launch time drops to 12 seconds.
This example shows how a pc performance monitor identifies hidden causes of lag. Without it, the user might have assumed the game was poorly optimized or upgraded hardware unnecessarily.
For users building custom rigs, a pc performance monitor is essential. I once helped a friend troubleshoot a system that crashed during stress tests. Using HWMonitor, we discovered the motherboard's VRM (voltage regulator module) was overheating-its temperature reached 110°C. The issue wasn't the cpu or cooling; it was the power delivery circuit. Replacing the motherboard resolved the crashes.
When choosing a tool, prioritize accuracy and low overhead. Avoid monitors that consume 15% of cpu themselves. Look for ones with minimal startup impact and real-time refresh rates under 100ms. Many free tools meet these standards.
Understanding your system's behavior requires more than instinct. A pc performance monitor turns invisible strain into visible data. preparing for a stream, it provides the clarity needed to act.