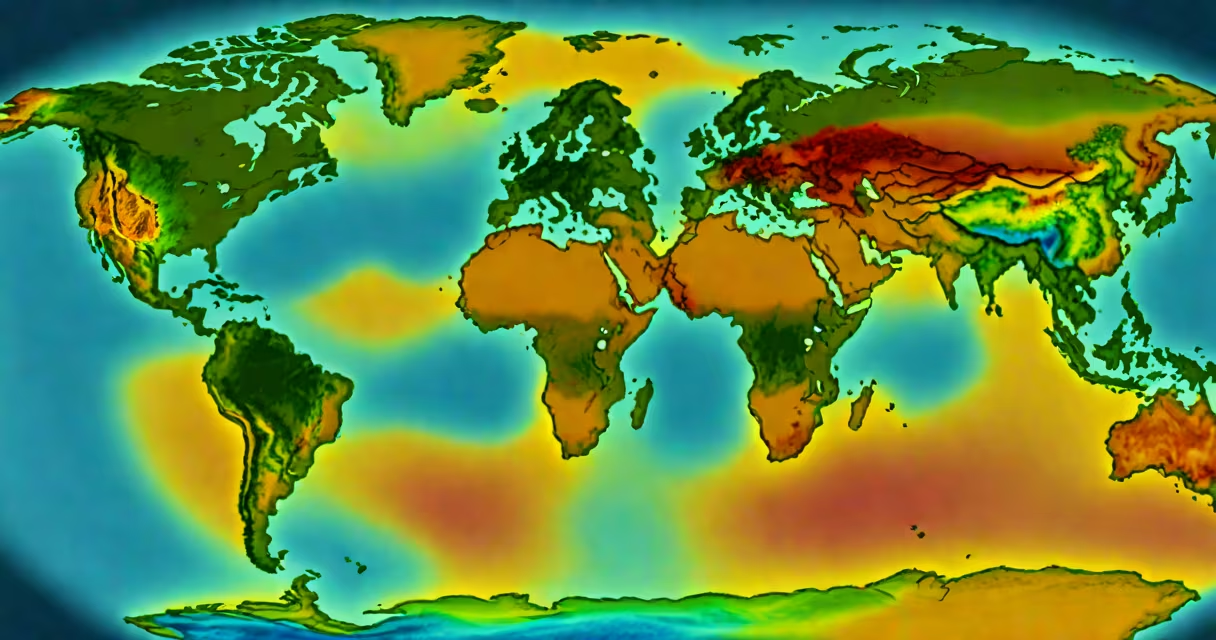
Daily sea surface temperature (SST) is the measurement of the ocean's uppermost layer-typically the top 1 to 2 meters-taken every 24 hours. It reflects the thermal state of the ocean's surface and is used globally in weather prediction, climate research, and marine operations.
SST is measured using satellites, buoys, ships, and automated sensors. Satellites detect infrared and microwave radiation emitted from the ocean surface, while in-situ instruments record direct readings. Data is collected continuously and processed into daily global maps. The National Oceanic and Atmospheric Administration (NOAA) and the European Centre for Medium-Range Weather Forecasts (ECMWF) maintain the most widely used datasets.
For example, during El Niño events, SST in the central and eastern tropical Pacific rises above average by 1°C to 3°C. In 2015-2016, satellite observations showed SST anomalies exceeding 2°C in parts of the equatorial Pacific, which helped forecasters predict extreme rainfall in California and drought conditions in Southeast Asia.
Remote sensing via satellites provides broad spatial coverage. Instruments like the Advanced Very High Resolution Radiometer (AVHRR) on NOAA satellites and the Moderate Resolution Imaging Spectroradiometer (MODIS) on NASA's Terra and Aqua satellites capture thermal emissions. These sensors measure brightness temperature, which is then corrected for atmospheric interference and emissivity to estimate actual SST.
In-situ measurements come from drifting buoys (part of the Global Drifter Program), moored buoys (like those in the Tropical Atmosphere Ocean range), and ship-based thermometers. Buoys drift with ocean currents and report data hourly. Ship data is less frequent but valuable for long-term trend analysis. All sources feed into merged datasets such as NOAA's Optimum Interpolation Sea Surface Temperature (OISST).
A key challenge is distinguishing between skin temperature-the very top microns-and bulk temperature. Satellites measure skin SST, while buoys report bulk SST. This difference matters because wind and solar heating affect the skin layer more. To reconcile this, models apply corrections based on wind speed and solar insolation. For instance, under high winds, skin SST can be 0.5°C cooler than bulk due to turbulent mixing.
Different datasets serve different purposes. Here's a comparison:
| Data Source | Temporal Resolution | Spatial Resolution | Primary Use |
|---|---|---|---|
| NOAA OISST | Daily | 0.25° × 0.25° | Climate monitoring, model validation |
| NASA MODIS | Daily (twice daily over land) | 1 km | High-resolution event tracking, research |
| Global Drifter Program | Hourly (binned to daily) | Variable (global network) | Ground-truthing, regional modeling |
Each dataset has trade-offs. OISST combines satellite and buoy data for consistency, making it ideal for long-term climate studies. MODIS offers finer detail but gaps in cloudy regions. Drifters provide accurate local values but sparse coverage.
One misconception is that daily SST represents the entire ocean depth. It does not. The top 1 meter holds most of the heat, but deeper layers remain stable. A 1°C change in daily SST can signal significant energy shifts-even if the subsurface remains unchanged.
Another error is assuming satellite data is always accurate. Cloud cover blocks infrared sensors, leading to missing data. Microwave sensors work through clouds but have lower resolution. Algorithms fill gaps using neighboring pixels, but errors can persist in storm zones. For example, during Hurricane Katrina in 2005, cloud cover obscured SST in the Gulf of Mexico for several days, delaying early warnings.
A lesser-known fact: daily SST influences fisheries. Warmer waters push species like tuna and sardines toward cooler regions. In 2014, a marine heatwave off California raised SST by 2°C above normal, causing anchovy populations to collapse and forcing fishing fleets to relocate 500 kilometers north.
Weather services rely on daily SST to predict storm development. Warm ocean surfaces fuel hurricanes by releasing latent heat. The National Hurricane Center uses SST thresholds-above 26.5°C-to assess hurricane potential. In 2020, Hurricane Laura intensified rapidly over the Gulf of Mexico, where daily SST exceeded 30°C, contributing to its Category 4 strength.
Marine biologists track SST to monitor coral bleaching. Corals expel symbiotic algae when SST stays 1°C above seasonal average for five consecutive weeks. The 2016 global bleaching event was triggered by sustained warm SST in the Great Barrier Reef, with daily records showing anomalies lasting over 100 days in some areas.
I once observed a field deployment of autonomous floats in the North Atlantic. We compared their real-time SST readings against satellite estimates. On a clear morning, the satellite reported 14.2°C, but the float recorded 13.8°C. The difference came from a thin layer of cool water near the surface caused by nighttime cooling. This mismatch highlighted the limits of remote sensing and reinforced the need for in-situ verification.